Community Trust ScoreVerified
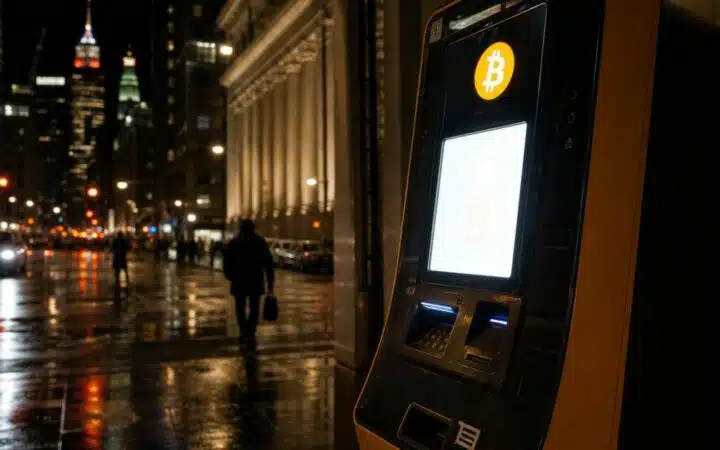
Bitcoin can’t quite commit. The cryptocurrency was hovering right around $76,738 early Tuesday, stuck in a tight band that’s kept traders guessing for days now, with the $76,000 level acting as the line everyone’s watching.
That $76,000 mark didn’t come out of nowhere. It’s the floor that’s held firm after a multiweek run-up that pushed Bitcoin to this point in the first place. The advance was real and it was sustained — but now Bitcoin’s kind of just sitting there, breathing, while the market figures out what comes next. Consolidation phases like this aren’t unusual after a strong rally. The price compresses, volatility tightens, and traders basically wait each other out. What makes this one worth watching is how clean that support has been. It hasn’t cracked. Not yet, anyway.
Charts Across Every Time Frame Tell the Same Murky Story
Pull up the one-hour chart and you get intraday chop — small swings in both directions, no real conviction. Flip to the four-hour and it’s pretty much the same read: cautious, range-bound, nothing decisive. The daily chart doesn’t clear things up either. All three time frames are basically pointing at the same thing — indecision. Traders are reading these charts hard and still can’t agree on what’s coming.
That’s the tricky part. When the short-term, medium-term, and longer-term charts all say “maybe,” you end up with a market that’s frozen in place. Some traders see the tightening volatility as a coil — pressure building before a big move. Others see it as fragility, a market that could slip if the wrong catalyst shows up. Both reads are technically defensible right now, which is exactly why nobody’s pulling the trigger on a major position.
The compression of volatility is worth flagging on its own. Historically, when Bitcoin’s price range narrows this sharply after a sustained advance, something usually breaks the pattern — up or down. The direction, though? Unclear. No definitive signals have come through, and no major market participants have gone on record with a strong directional call.
The $76,000 Floor Is Doing Real Work
Support levels in crypto aren’t magic lines. They’re just prices where enough buyers have shown up repeatedly to stop a sell-off from accelerating. Around $76,000, that’s been happening. Every dip toward that number has found buyers willing to step in, which keeps the floor intact and keeps the broader structure from breaking down.
But holding support isn’t the same as breaking out. Bitcoin’s sitting above $76,000, sure — but it’s also not pushing meaningfully higher. The multiweek advance stalled out here, and the market’s been in this compressed range since. Traders are watching whether buyers can build enough momentum to push through resistance above, or whether the support eventually gives way under selling pressure.
It’s a binary setup, and the market knows it. That’s probably why volume has been relatively subdued and why the price action has stayed so tight. Nobody wants to be caught on the wrong side of a sharp move.
And sharp moves do happen. Bitcoin’s history is full of them — quiet consolidations that end with violent breaks in one direction. The current pattern fits that mold pretty well. A few sessions of tight range trading, volatility squeezing down, traders watching the same levels. Then something shifts.
What shifts it is the harder question. Macro factors are always in the background — rate expectations, dollar strength, risk appetite across broader markets. Regulatory noise can move things fast too. None of those external inputs are showing a clear read right now, which probably adds to the market’s hesitation.
Traders who’ve been in Bitcoin long enough know what this kind of setup feels like. It’s not comfortable. The waiting is its own kind of pressure. Every hour the range holds, the eventual break feels more significant — because the longer the compression, the more energy tends to release when it ends.
For now, Bitcoin stays near $76,738. The $76,000 support holds. The charts stay mixed. And traders stay glued to their screens, watching for the first real sign that something’s about to change.
No clear breakout. No breakdown. Just Bitcoin, sitting at a critical level, with the market split on what happens next.
Frequently Asked Questions
What price level is Bitcoin holding as support right now?
Bitcoin is holding near $76,000 as a key support level, with the price hovering around $76,738 as of early Tuesday.
What are traders watching for on Bitcoin’s charts?
Traders are monitoring the one-hour, four-hour, and daily charts for signs of a breakout above resistance or a breakdown below the $76,000 support level that has held firm after Bitcoin’s recent multiweek advance.