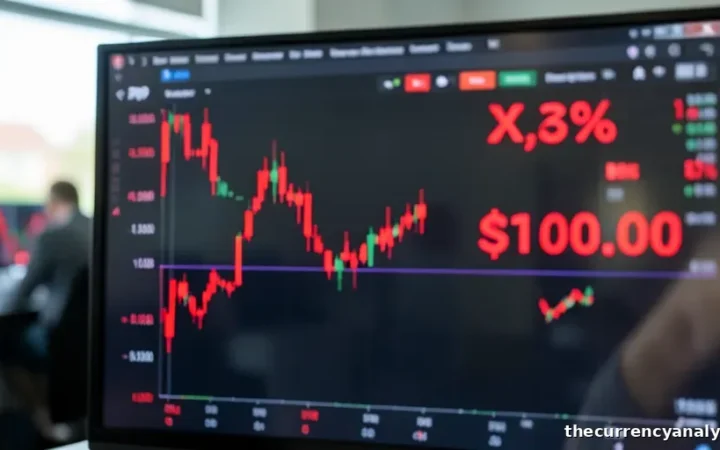
XRP stands at $0.96 on November 16, down more than 1% in the last 24 hours. The token has erased nearly 14% of its value over the past week and 26% over the last month. During the weekend, selling pressure briefly pushed the price to around $0.89 before buyers stepped in to lift it back toward $0.97. The asset remains below the $1.00 mark it surrendered on November 14.
Leverage and Liquidation Data
CryptoQuant data shows a $44 million imbalance between long and short liquidations on November 14. This represents the largest daily gap between the two sides since October 2025. The figure tracks the excess of forced long closures over short closures, rather than the total value of liquidated positions. Binance accounted for $21 million of this difference, with Bybit recording $12 million and OKX logging $11 million.
Binance’s XRP futures open interest has dropped to approximately $325 million, its lowest level since November 2024. The estimated leverage ratio on the exchange fell to roughly 0.13, also its lowest reading since that same period. During 2025, this ratio had approached 0.60. On November 10, the 30-day cumulative funding rate hit about 0.18%, the highest level since October 2025. Positive funding rates mean long traders are paying short traders to keep their positions open.
Support Levels and Analyst Targets
US spot XRP exchange-traded funds saw net withdrawals of $19.13 million in the week ending November 13. Technical indicators reflect the recent selling pressure. The relative strength index (RSI) sits at 26.08, below the 30 oversold threshold. The MACD reading is -0.0954, which is lower than its signal line at -0.0769. The 24-hour trading range spanned from $0.9433 to $0.9773, with volume at $1.68 billion.
Analyst Carolina noted that XRP broke below key weekly moving averages and lost support near $1.03. “Now is not the time to be blindly bullish,” Carolina said. She pointed to $0.80, $0.75, and $0.70 as potential support levels. For XRP to challenge $1.50, Carolina argues the price must first recover $1.03 and the $1.23–1.29 zone. A separate downside view places possible support at $0.85 and $0.80 if the market fails to reclaim $1.00.
ChartNerd sees the 0.90–0.70 area as a potential accumulation zone within an eight-and-a-half-year cup-and-handle formation. The analyst maintains a conditional long-term target of 5–8. “Nothing is guaranteed, and I do not have a crystal ball,” ChartNerd stated. Trader Charting Guy describes the drop as a possible Wyckoff reaccumulation pattern with weekly bullish divergence. He retains a target of $4.36, provided the bullish pattern develops as expected.