XRP is trading at $0.9927, marking an 11% increase from its recent low of $0.89. This move has brought the asset back to the $0.99 area, a level that served as the August low. While the price has formed a local reversal with one higher high following another, the technical picture remains mixed, with indicators pointing to both potential further decline and the possibility of recovery.
Fading Momentum and Overhead Resistance
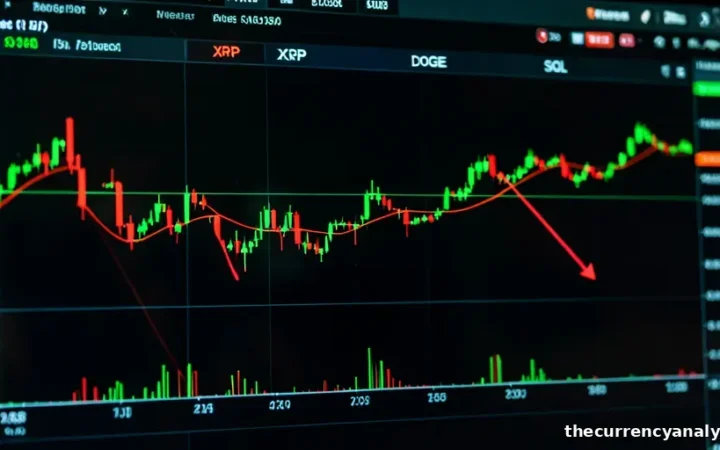
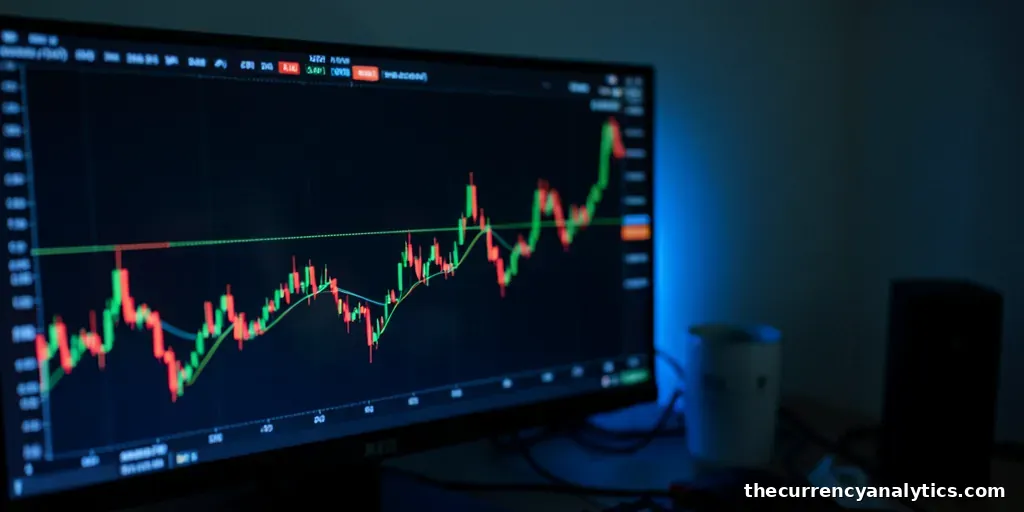
The recent upside in price is accompanied by descending volume, a factor that suggests fading momentum in the current rally. All moving averages currently sit above the spot price, with the nearest one located around $1.13. This configuration is described as an anti-volatility signal, indicating that the market structure remains bearish despite the short-term bounce.
XRP had not traded below the $1 mark since mid-August. The asset dropped under this key psychological level for the first time since November 2024, following a general reversal in the broader cryptocurrency market. The price action has since established a pattern of constant downtrend punctuated by occasional recoveries that have historically turned into new breakdowns.
RSI Signals and Historic Patterns
The Relative Strength Index (RSI) is currently around 33, slowly moving above the oversold zone from a low near 27. However, this recovery in the RSI is characterized as worrying because it opens the way for an additional leg down. The indicator’s movement suggests that the bearish pressure may not yet be exhausted.
In early November, XRP bounced from approximately $1.20 to the $1.30 area. The subsequent breakdown saw the price fall by around 30% in under two weeks. This recent downtrend is described as stronger than the bullish reversal attempts observed earlier in the month. A sustainable downtrend of this nature could persist for months, according to the technical assessment.
For a market recovery to be confirmed, specific signs of a bull run would be required, such as the formation of higher highs and sustained buying pressure. Until those conditions are met, the price remains vulnerable to further downside, with the $1 level acting as the previous support that is now under pressure.