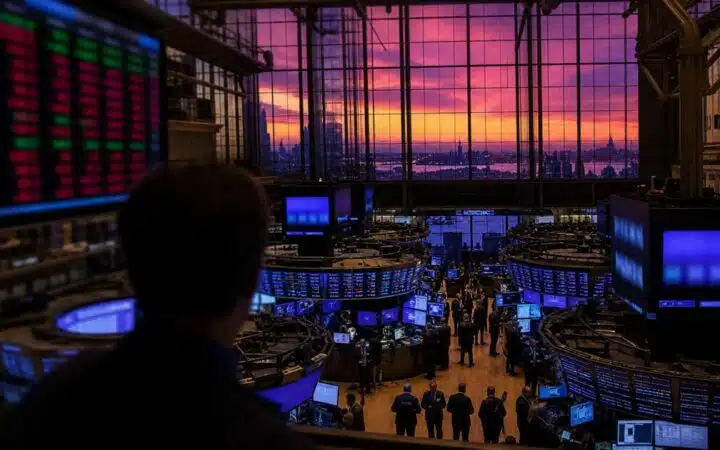
Community Trust ScoreVerified
Bitcoin fell back below $80,000. Again.
The cryptocurrency just bounced 37% from April’s lows, but now it’s stuck. XWIN Research Japan says BTC hit the 200-day moving average near $82,400 and couldn’t push through. That level? It’s where Bitcoin died in March 2022, right before the real pain started. Same resistance. Same hesitation. The pattern’s pretty much identical, and traders see it.
On-Chain Data Shows Warning Signs
XWIN pulled CryptoQuant data and found something uncomfortable. Bitcoin’s unrealized profit margin sits at 17.7% right now—the highest since June of last year. Back in March 2022, the margin looked similar before everything collapsed. Profit-taking seems inevitable when numbers get this fat. And on May 4, traders realized 14,600 BTC in daily profits. That’s the biggest spike since December, and those spikes usually mark local tops. Not always. But usually.
The 200-day moving average matters because it’s killed rallies before. In bear markets, temporary bounces die right there. Bitcoin touched it, got rejected, and now trades around $79,700. Volume dropped during the recent climb, which means momentum’s fading. Buyers aren’t showing up with conviction near resistance. They’re waiting, probably smart.
But Things Look Different This Time
The market structure changed since 2022. Spot demand contracted from -91,000 BTC in April to around -11,000 BTC now, per XWIN’s analysis. That’s a massive shift. Selling pressure dried up fast. Long-term holders aren’t panicking either—they’re mostly sitting tight. And the buyers coming in aren’t retail gamblers. Average spot order sizes suggest large investors, the kind with deeper pockets and longer time horizons.
Institutional support wasn’t around in 2022. Now there’s spot ETFs. Corporate adoption. The CLARITY Act pushed regulatory clarity forward. These factors create a support layer that didn’t exist last cycle. Bitcoin’s got structural backing now, not just speculation and leverage. That might matter. It might not. Markets don’t care about narratives when they want to go down.
Support holds at $73,000 to $75,000. Bitcoin’s defended that zone through recent volatility, and shorter-term moving averages are rising underneath it. As long as that floor stays intact, the recovery structure looks okay. Not great, but okay. Break below it and the April lows come back into play fast.
Caught Between Key Levels
So Bitcoin’s trapped. Support below, resistance above. The $80,000 to $82,400 range is the battleground right now. Bulls need to reclaim the 200-day moving average and hold it, not just spike through and fade. Bears want to see volume pick up on the downside and crack support. Neither side’s winning yet.
Large capital seems to be accumulating rather than exiting, based on order flow data. That’s different from past bear-market bounces when retail rushed for the exits. Strategic positioning versus panic—the composition of market participants shifted. Informed money sticking around through chop usually means something, though it doesn’t guarantee upside.
The current cycle might diverge from history. Or it might rhyme perfectly, just with a delay. Institutional infrastructure and regulatory progress create variables that weren’t present before. Bitcoin’s market is more complex now, with more participants and more capital types. That complexity cuts both ways—it can provide support or create new failure modes nobody’s seen yet.
Volume tells a story too. Trading activity fell off as Bitcoin approached resistance. Participants are cautious, waiting for confirmation before committing. That hesitation is visible in the tape. Big moves usually need conviction, and conviction needs volume. Right now there’s neither.
The 14,600 BTC profit realization on May 4 stands out. That’s a lot of selling in one day. When traders lock in gains at that scale, it often marks short-term exhaustion. Not always the final top, but a pause at minimum. Combined with the 17.7% unrealized profit margin, there’s a lot of incentive to sell into strength. And people usually take that incentive.
Bitcoin’s path forward remains murky. The technical setup is clear enough—resistance above, support below—but the resolution isn’t. Markets can stay stuck in ranges for weeks or months before picking a direction. This range might be no different. Traders are watching $82,400 on the upside and $73,000 on the downside. Break either and things get interesting fast.
The comparison to March 2022 is uncomfortable because that rally failed hard. Bitcoin bounced, hit the 200-day moving average, and then spent months grinding lower. The pattern recognition is obvious. But patterns break too. Institutional support, tighter supply dynamics, and different market composition could flip the script. Or not. Data will decide, not hope.
For now, Bitcoin trades near $79,700 with no clear catalyst to push through resistance. The 200-day moving average looms overhead, a reminder of past failures. Support holds below, but support always holds until it doesn’t. The market’s at a decision point, caught between historical patterns and new structural factors. Which one wins is still unclear.
Frequently Asked Questions
What is Bitcoin’s current resistance level and why does it matter?
Bitcoin faces resistance at the 200-day moving average near $82,400, the same technical level where it failed during the March 2022 bear market rally before continuing lower.
How does current market structure differ from the 2022 bear market?
Spot demand contraction narrowed from -91,000 BTC to -11,000 BTC, long-term holders aren’t panic selling, and institutional support through ETFs and corporate adoption provides structural backing absent in 2022.
What on-chain signals suggest potential profit-taking?
Bitcoin’s unrealized profit margin reached 17.7%, the highest since June 2025, and traders realized 14,600 BTC in profits on May 4, the largest spike since December 2025.