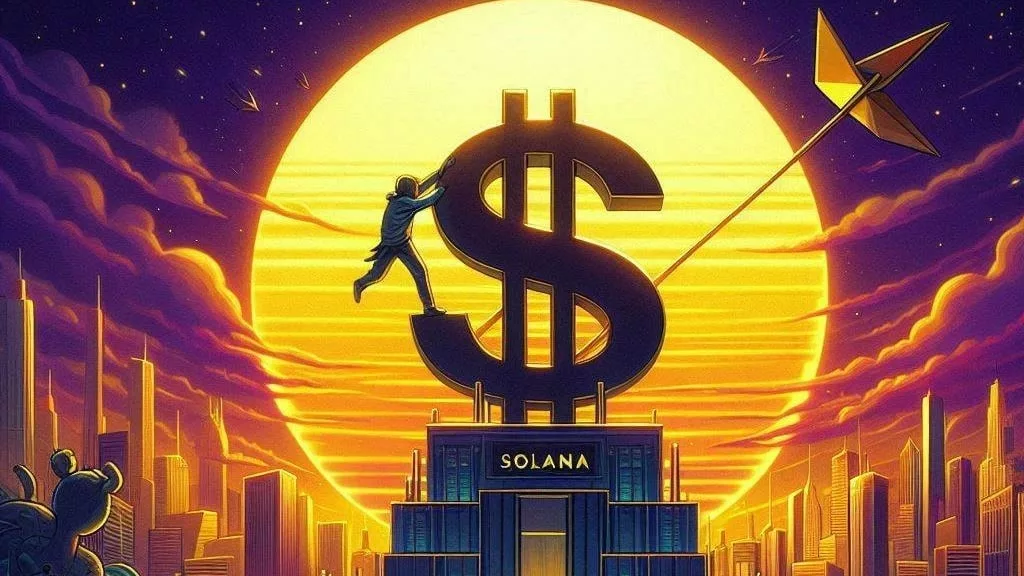
While Solana (SOL) may appear calm on the surface, crypto analysts and traders are keeping a close eye on a very specific number: $129.79. This price level has quietly emerged as a crucial support zone—one that could determine where SOL moves next in the short term.
According to recent on-chain data, over 32 million SOL tokens—roughly 5% of the total circulating supply—have been bought around the $129.79 price level. This makes it the largest accumulation zone seen in Solana’s history.
This insight comes from the UTXO Realized Price Distribution (URPD) metric, which maps out the cost basis of current holders. Essentially, URPD data highlights where the majority of capital is concentrated and gives clues about potential support or resistance zones.
What does this mean for traders and investors? When so many holders have bought around the same price, that level tends to act as a strong psychological and technical support. Many investors consider this their “fair value” zone, which they will be inclined to defend during market downturns. This behavior reduces selling pressure and increases the likelihood of a bounce from that level.
Looking at the broader picture, Solana has been trading sideways within a relatively narrow range—between $117 and $144. Right now, the price is sitting just below the critical $129.79 mark, showing signs of tight consolidation.
Technical indicators reflect this indecision:
The Relative Strength Index (RSI) is hovering around neutral, suggesting neither bullish nor bearish momentum is dominant.
The On-Balance Volume (OBV), which helps track buying and selling pressure, has flattened out—indicating a lack of strong direction.
In other words, Solana appears to be in a coiling pattern. Such price compression typically sets the stage for a breakout—but the direction of that breakout remains uncertain. The closer the price hugs the $129 zone, the more likely it becomes that this level will act as a key turning point.
When large amounts of supply are concentrated around a specific price, it tends to become a self-fulfilling prophecy. Investors who entered the market at that level often treat it as a psychological anchor—reluctant to sell at a loss and quick to buy again if prices return to their entry point.
As a result, $129.79 could become what analysts call a “make-or-break zone.” If the price drops below it, the level may flip into resistance, and SOL could head toward its next support near $117. On the flip side, holding above this level and reclaiming momentum could see Solana test the $144 resistance—and possibly break through it.
Beyond the charts, Solana continues to be one of the most active layer-1 blockchain platforms in terms of development, user activity, and ecosystem growth. Its high throughput and low fees have made it a go-to network for decentralized apps (dApps), NFTs, and DeFi projects.
The current consolidation may appear uneventful, but such quiet periods often precede significant price movements. With the broader crypto market watching, any strong breakout from this range—especially upward—could attract renewed attention and capital inflows.
For now, all eyes are on $129.79. This price point isn’t just another number—it’s a battlefield of investor conviction, technical structure, and psychological support. A decisive move above or below it could define Solana’s short-term trend for weeks to come.
If buyers continue to view $129 as a fair value, it could mark the foundation for Solana’s next rally. If not, a drop below may signal a broader market correction—or at least more sideways action ahead.
Either way, Solana is poised at a critical juncture. And as any trader will tell you, tight ranges don’t last forever.


Get the latest Crypto & Blockchain News in your inbox.