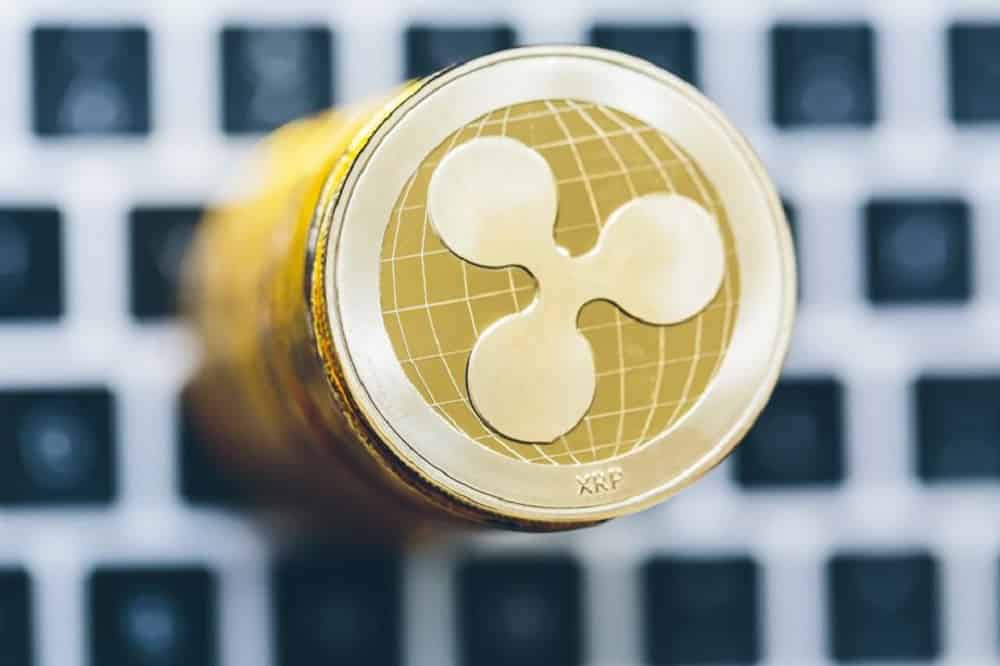
XRP is thus projected to have a strong bullish trend on a long run, though short-term bullish trends are seen.
XRP is now considered to be far more decentralized than the Ethereum and Bitcoin. It is seen on the top in the cryptocurrency leaderboards. Some are seen to criticize the XRP ledger stating that it is centralized. And, that they are using some other alternative consensus to sustain their trends.
Garlinghouse however, stated, “XRP is more decentralized than the Bitcoin or Ethereum ledger.”
The head of Ripple stated that he would like to maintain the transparency doing what they are doing rather than trying to rectify what the community is thinking. He further implied that XRP would trade even if ripple bites the dust.
Regardless of the rumor mill, it can be seen that the price of XRP is moving up slowly. XRP has seen nearly 70,000 transactions with an average time of 3.7 seconds, which is very impressive when compared to the traditional financial systems and solutions. It is expected that XRP will touch the $0.4 before the end of the year. We need to witness if there will be an increase in the trading activity.
Almost all coins were back in the green zone, therefore, showing a bullish trend in the cryptocurrency market. XRP has a total market capitalization of $15 billion, currently trading at $0.37. XRP has shown 27.9% in growth rate per weekly statistics. The top trading volume at present is at 12%. This is seen in the Japanese Exchange Platform, Bitbank.
The hourly chart of XRP reveals an uptrend from $0.297 through $0.377. The support level is at 0.357, and the resistance level is at $0.397 accordingly.
Chaikin Money Flow [CMF] is seen below the zero line, thus indicating a decreased inflow of money in XRP market during the current time.
Awesome Oscillator sustained the bars above zero line, thus slowly changing to green in the current moment.
Parabolic SAR shows dotted indicators above candlesticks, thereby pushing the price downtrend. There was a bullish trend for more than a day, and the current bear trend is seen following it.
Looking at the daily chart, XRP reveals an uptrend ranging anywhere from $0.26, $0.28 and $0.37. The downtrend ranges from $0.52 – $0.377. Also, the resistance point is now set at $0.56.
MACD reveals a bullish crossover and the moving average line is above signal line. Strong green bars are seen in the histogram confirming bull trend through the long run.
Bullish trend is seen in the Relative Strength Indicator [RSI] providing for a bullish trend. The trends are seen to move towards over buying.
Aroon Indicator reveals an uptrend strength providing for a positive sign; downtrend is exhausting though.
Get the latest Crypto & Blockchain News in your inbox.