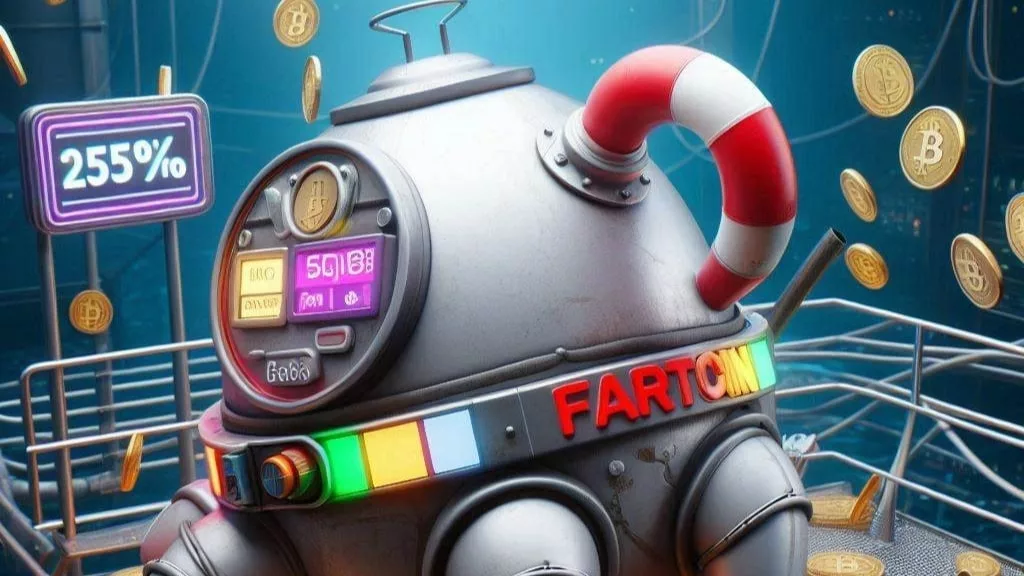
FARTCOIN, a cryptocurrency coin built on the Solana blockchain, has stunned the crypto community with an explosive 250% price surge over the past month. Despite broader market volatility, this little-known altcoin has outperformed many top cryptocurrencies, riding a wave of hype and speculative momentum. However, technical indicators now suggest that the rally may be running out of steam, as signs of buyer exhaustion begin to appear. While bullish sentiment remains strong, analysts caution that a correction may be imminent if momentum continues to fade.
Over the last 30 days, FARTCOIN has emerged from relative obscurity to become one of the most talked-about cryptocurrency coins in the market. The sharp rise in price has been driven by speculative trading, strong community backing, and social media buzz. However, as with many parabolic rallies in the crypto space, rapid gains often lead to equally sharp reversals—and several technical indicators now point to potential weakness ahead.
One key signal is the Bollinger Bands (BB) indicator, which shows FARTCOIN’s price trading above its upper band. Bollinger Bands help assess whether an asset is overbought or oversold by measuring price volatility around a moving average. When the price moves above the upper band, it generally indicates that the asset is trading well above its average value and may be due for a correction. FARTCOIN’s recent breach of the upper BB line suggests that the coin may now be in overbought territory, increasing the likelihood of a near-term pullback.
Adding to the concern is the token’s Relative Strength Index (RSI), which currently sits at 69.09—just below the overbought threshold of 70. The RSI is a momentum oscillator that evaluates the speed and change of price movements on a scale from 0 to 100. A reading above 70 typically signals that an asset is overbought, while a value below 30 indicates it’s oversold. With FARTCOIN’s RSI hovering just beneath the critical overbought level, there is growing concern that momentum could be fading. If the RSI climbs any higher without a meaningful consolidation, traders may begin to lock in profits, triggering selling pressure.
The price action moving forward could go in one of two directions. If buying interest weakens and profit-taking accelerates, FARTCOIN could fall to test key support levels. Initial support is expected around $0.74, a price level that previously served as a consolidation zone during its recent climb. If that support fails to hold, analysts warn that the token could slip further toward $0.37—a level not seen since before the rally began.
On the other hand, if bulls manage to sustain current momentum and defend support levels, the uptrend could continue. In a more optimistic scenario, FARTCOIN could climb as high as $1.16, a target that some traders are eyeing based on Fibonacci extension levels and bullish sentiment. To reach this target, however, the coin would need a fresh wave of volume and renewed interest from both retail and social-driven traders.
In the fast-moving world of coins, sentiment can flip quickly. While FARTCOIN’s explosive 250% rally has delivered impressive short-term returns, current market signals suggest caution. Investors and traders alike should closely monitor volatility indicators and support levels in the coming days. Whether the next move is a breakout to new highs or a correction to lower support zones, FARTCOIN’s next chapter is likely to be just as volatile as the last.


Get the latest Crypto & Blockchain News in your inbox.